
Your business metrics.
All in one view.
Six role-based dashboards show each team member exactly what they need. Real-time KPIs, charts, and alerts — no spreadsheets required.
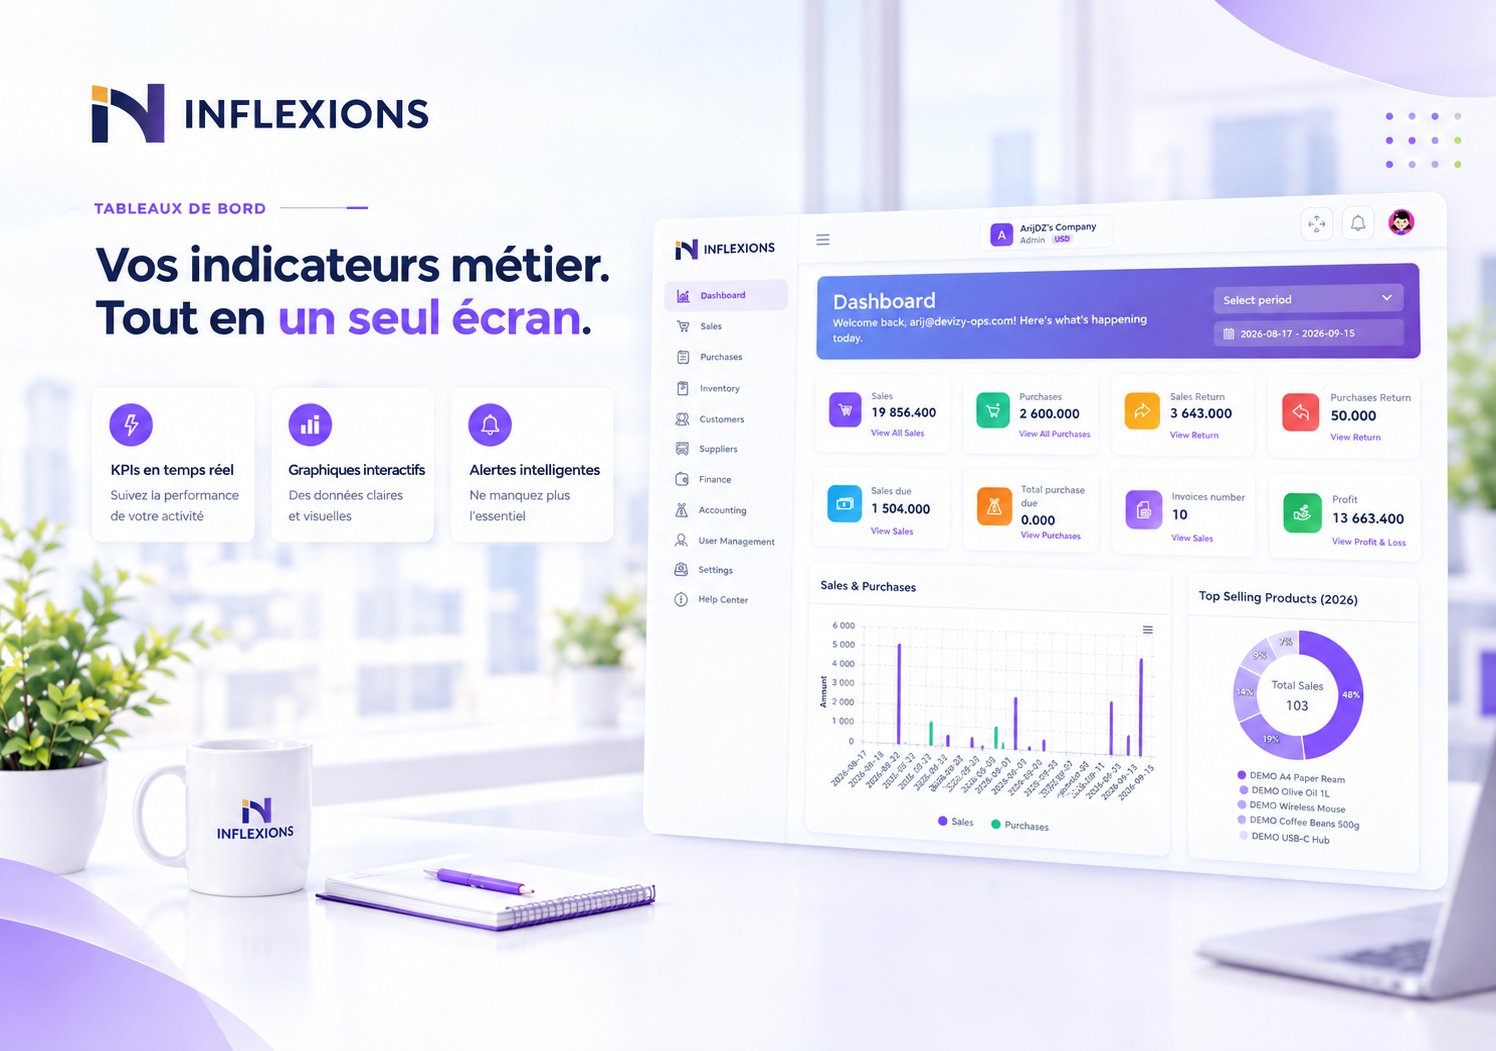
6 dashboards, one for each role
Every team member sees what's relevant to their work. Admins see the big picture. Sales managers see pipeline. Accountants see the ledger.
Main Dashboard
Admin role
- Total revenue & expenses
- Top products & customers
- Recent sales & purchases
- Payment status overview
- Cash flow trend
Sales Dashboard
Sales Manager role
- Revenue by period
- Order count & average value
- Top selling products
- Top customers by revenue
- Quotation conversion rate
Purchase Dashboard
Purchase Manager role
- Procurement spend by period
- Supplier activity & ranking
- Purchase order status
- Payment due tracker
- Cost trend analysis
Inventory Dashboard
Inventory Manager role
- Stock levels by warehouse
- Low stock alerts
- Dead stock identification
- Stock aging analysis
- Transfer & adjustment history
Finance Dashboard
Finance Manager role
- Cash flow overview
- Expenses by category
- Deposits & revenue
- Outstanding receivables
- Outstanding payables
Viewer Dashboard
Viewer role
- Personal sales summary
- Own quotations & orders
- Assigned customer activity
- Read-only KPIs
- No aggregated data from other users
30+ built-in reports
Every report exports to PDF and Excel. Filter by date, warehouse, customer, or category.
Sales & Revenue
- Sales report
- Product sales report
- Sales by category
- Sales by brand
- Discount summary
- Tax summary
- Draft invoices
- Return ratio
Purchases & Procurement
- Purchase report
- Product purchases report
- Supplier ranking
Inventory & Stock
- Stock levels
- Inventory valuation
- Negative stock
- Dead stock
- Stock aging
- Stock transfers
- Stock adjustments
- Quantity alerts
Financial
- Profit & Loss
- Cash flow
- Expense report
- Deposit report
- Transaction report
Payments
- Sale payments
- Purchase payments
- Sale return payments
- Purchase return payments
People
- Customer report
- Supplier report
- Top customers
- Top suppliers
- Inactive customers
- Loyalty points
- User activity
- Seller performance
Custom Date Ranges
Filter any report or dashboard by custom date ranges. Compare week-over-week or month-over-month.
Export to PDF & Excel
One-click export for any report. Share with your accountant, bank, or management team.
Role-Based Access
Each dashboard is permission-controlled. Users only see data relevant to their role — no data leakage.
See your data come alive
Schedule a demo and we'll walk you through the dashboards using your industry as an example.